Custom Search
|
|
 
|
||
|
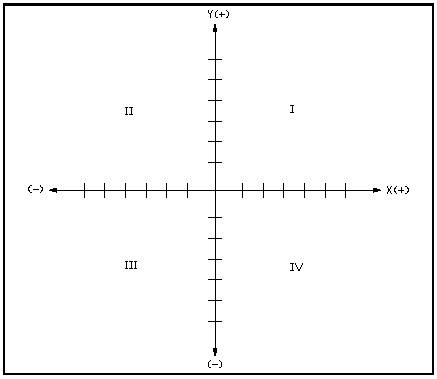
Vector quantities are graphically represented using the rectangular coordinate system, a two-dimensional system that uses an x-axis and a y-axis. The x-axis is a horizonal straight line. The y-axis is a vertical straight line, perpendicular to the x-axis. An example of a rectangular system is shown in Figure 3.
The intersection of the axes is called the point of origin. Each axis is marked off in equal divisions in all four directions from the point of origin. On the horizonal axis (x), values to the right of the origin are positive (+). Values to the left of the origin are negative (-). On the vertical axis (y), values above the point of origin are positive (+). Values below the origin are negative (-). It is very important to use the same units (divisions) on both axes.
Figure 3 Rectangular Coordinate System The rectangular coordinate system creates four infinite quadrants. Quadrant I is located above and to the right of the origin. Quadrant II is located above and to the left of the origin. Quadrant III is situated to the left and below the origin, and quadrant IV is located below and to the right of the origin (see Figure 3). |
 
|
|
|
||
|
|
Integrated Publishing, Inc. - A (SDVOSB) Service Disabled Veteran Owned Small Business
|