| Tweet |

Custom Search
|
|
 
|
||
|
Actual
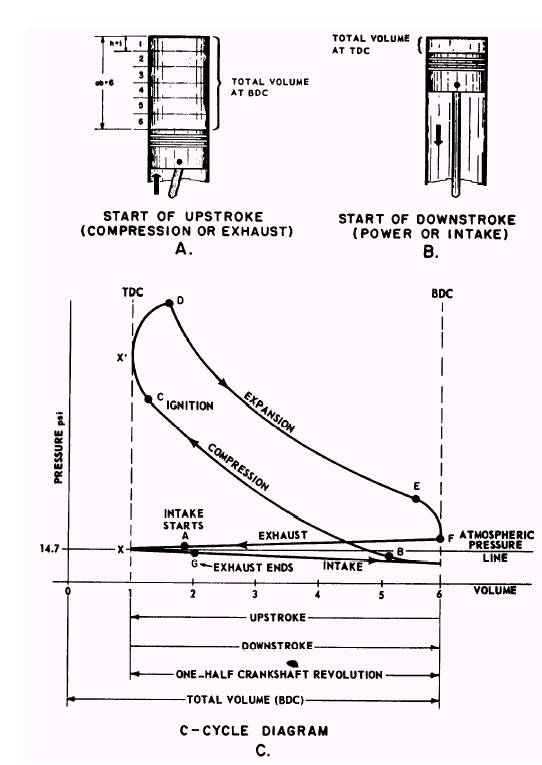
Combustion Cycles The preceding discussion covered the theoretical (true) combustion cycles which serve as the basis for modern engines. In actual operation, modern engines operate on modifications of the theoretical cycles. However, some characteristics of the true cycles are incorporated in the actual cycles of modern engines, as you will see in the following discussion of examples representing the actual cycles of operation in gasoline and diesel engines. The examples we will use are based on the 4-stroke mechanical cycle so that you may compare the cycles found in both gasoline and diesel engines. (The majority of gasoline engines use this 4-stroke mechanical cycle.) We will also point out differences existing in diesel engines operating on the 2-stroke cycle. The diagrams in figures 2-6 and 2-7 are representative of the changing conditions in a gasoline and a diesel cylinder during actual engine operation. Some of the events are exaggerated to show more clearly the changes that take place and, at the same time, to show how the theoretical and actual cycles differ. The compression ratio situation and a pressure-volume diagram for a 4-stroke Otto cycle are shown in figure 2-6. View A shows the
Figure 2-6.Pressure-volume diagram for an Otto (gasoline) 4-stroke cycle.
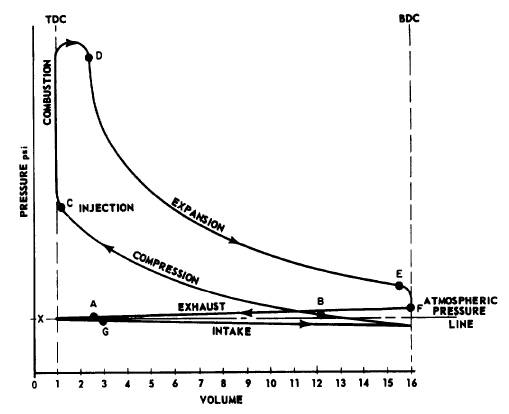
Figure 2-7.Pressure-volume diagram for a diesel 4-stroke cycle. piston on BDC at the start of an upstroke. (In a 4-stroke cycle engine, this stroke could be identified as either the compression stroke or the exhaust stroke.) Study views A and B of figure 2-6. Notice that in moving from BDC to TDC (view B), the piston travels five-sixths of the total distance AB. In other words, the VOLUME has been decreased to one-sixth of the volume when the piston was BDC. Thus, the compression ratio is 6:l. View C of figure 2-6 shows the changes in volume and pressure during one complete 4-stroke cycle. Notice that lines representing the COM-BUSTION and EXHAUST phases are not as straight as they were in the theoretical diagram. The vertical line at the left represents cylinder pressure in pounds per square inch (psi). Atmospheric pressure is represented by a horizontal line called the ATMOSPHERIC PRESSURE LINE. Pressures below this line are less than atmospheric pressure, while pressures above the line are more than atmospheric. The bottom horizontal line represents cylinder volume and piston movement. The volume line is divided into six parts that correspond to the divisions of volume shown in view A. Since piston movement and volume are proportional, the distance between 0 and 6 indicates the volume when the piston was at BDC, and the distance from 0 to 1 indicates the volume with the piston at TDC. Thus, the distance from 1 to 6 corresponds to total piston travel with the numbers in between identifying changes in volume that result from the reciprocating motion of the piston. The curved lines in view C of figure 2-6 represent the changes of both pressure and volume that take place during the four piston strokes of the cycle. To make it easier for you to compare the discussion on the relationship of strokes and events in the diesel 4-stroke cycle (fig. 2-2) with the discussion on the Otto 4-stroke cycle (fig. 2-6), we will begin the cycle of operation at the IN-TAKE. (Refer to fig. 2-6.) In the Otto cycle, the INTAKE event includes the admission of fuel and air. As indicated earlier, the INTAKE event starts before TDC, or at point A in view C of figure 2-6. Note that pressure is decreasing and that after the piston reaches TDC and starts down, a vacuum is created that facilitates the flow of the fuel-air mixture into the cylinder. The INTAKE event continues a few degrees past BDC and ends at point B. Since the piston is now on an upstroke, COMPRESSION takes place and continues until the piston reaches TDC. Notice the increase in pressure (X to X) and the decrease in volume (F to X). Spark IGNITION at point C starts COMBUSTION, which takes place very rapidly. There is some change in volume since the COMBUSTION phase starts before TDC and ends after TDC. Pressure increases sharply during the COMBUSTION phase (curve CD). The increase in pressure provides the force necessary to drive the piston down again. The gases continue to expand as the piston moves toward BDC. The pressure decreases as the volume increases, from D to E. The EXHAUST event starts at point E, a few degrees before BDC. The pressure drops rapidly until the piston reaches BDC. As the piston moves toward TDC, there is a slight drop in pressure as the waste gases are discharged. The EXHAUST event continues a few degrees past TDC to point G so that the incoming charge aids in removing the remaining waste gases. The actual diesel combustion cycle (fig. 2-7) is one in which the COMBUSTION phase, induced by COMPRESSION/IGNITION, begins on a constant-volume basis and ends on a constant-pressure basis. In other words, the ACTUAL CYCLE is a combination of features found in both the Otto and the theoretical diesel cycles. The actual cycle is used as the basis for the design of practically all modern diesel engines and is referred to as a MODIFIED DIESEL CYCLE. An example of a pressure-volume diagram for a modified 4-stroke diesel engine is shown in figure 2-7. Notice that the volume line (bottom of figure) is divided into 16 units. These units indicate a 16:l compression ratio. The higher compression ratio accounts for the increased temperature necessary for ignition of the charge. Fuel is injected at point C and COMBUSTION is represented by line CD. While combustion in the Otto cycle is at constant-volume practically throughout the phase, combustion in the actual diesel cycle takes place with volume that is practically constant for a short period of time. During this period of time, there is a sharp increase in pressure until the piston reaches a point slightly past TDC. Then, combustion continues at a relatively constant pressure which drops slightly as combustion ends at point D. Pressure-volume diagrams for gasoline and diesel engines that operate on the 2-stroke cycle are similar to those just discussed. The only difference is that separate exhaust and intake curves do not exist. They do not exist because intake and exhaust occur during a relatively short interval of time near BDC and do not involve full strokes of the piston as in the 4-stroke cycle. Thus, a pressure-volume diagram for a 2-stroke modified diesel cycle will be similar to the diagram formed by the F-B-C-D-E-F cycle illustrated in figure 2-7. The exhaust and intake phases will take place between E and B with some overlap of the events. (Refer again to fig. 2-2.) The preceding discussion has pointed out some of the main differences between engines that operate on the Otto cycle and those that operate on the diesel cycle. In brief, these differences involve - the mixing of fuel and air, - the compression ratio, - the method of ignition, and - the combustion process. In regard to differences in engines, there is another variation you may find in the engines you operate and maintain. Sometimes, the manner in which the pressure of combustion gases acts upon the piston is used as a method of classifying engines. This method of classification is discussed in the information that follows. |
||
|
||