Custom Search
|
|
 
|
||
|
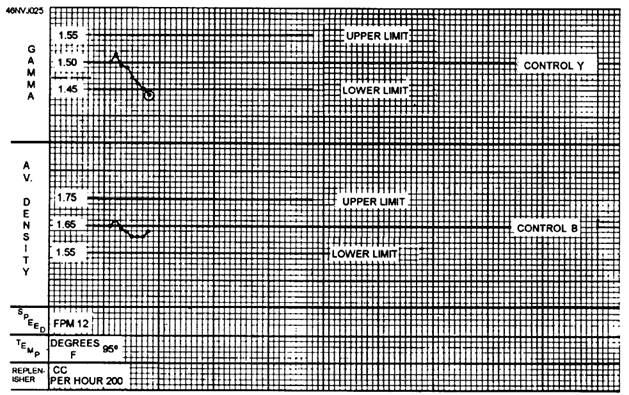
QUALITY ASSURANCE CONTROL CHARTS In photographic processing, control charts are used to monitor the status of
specific solutions and the physical process. A list of numbers can be studied
carefully to see whether they are out of line; however, when the numbers are
plotted on a chart, you can see instantly whether there is data out of order.
Photographic quality assurance control charts can be prepared for gamma or
contrast index, minimum and maximum density (D-min and D-max), average density ( If, for example, the control gamma in an aerial film processor is 1.50 and
the desired average density is 1.65, you must have a method for indicating when
the gamma
Figure 2-12.--Control chart. From each processing run, you should plot the gamma and
Remember that the existing tolerance or control limits, once set, should not be left there indefinitely. You should continually strive to improve the degree of control and, to do so, reestablish closer control limits periodically. The amount of information you can plot on control charts depends on several factors that may include, but are not limited to, the following: The product quality required *The equipment available *Personnel available and trained for QA duties You are not expected to monitor all the variables that are listed. Also you are not limited on what you can monitor. These decisions depend on the capabilities of each ima ing facility, and they change periodically Figure 2-l3 shows the way a control chart might look. It is an example only and should not be used to establish control parameters in your imaging facility. Before control charts are established, you must have a standard or starting point for each of the variables you intend to measure. These standards are derived by sensitometric or chemical tests over a given period of time or, in the case of color processing, are provided by the manufacturer. Generally speaking, when these tests are conducted within an imaging facility, they are to be performed by a PH with a background in photographic quality control (NEC 8126) or by a PH with extensive on-the-job training in QA. These specialists analyze the data collected over the test period, apply statistical formulas, and arrive at workable standards or means and upper- and lower-control limits. Therefore, in the rest of the discussion, assume that these standards have already been established. A word of caution, however, the chart, plot, and curve illustrations that follow are presented as examples only. They should not be used as a basis for the QA program in any lab. PLOTTING GAMMA OR CI ON A PROCESS-MONITORING CHART As explained previously, gamma and CI can be computed from the information plotted on a characteristic curve. Successive values are then plotted on control charts. When gamma plots on a control chart beyond the control limits, several causes may be indicated, some of which include the following: 0 The developer is being over- or underreplenished. *The film was over- or underdeveloped. The processing temperature was too high or too low. |
 
|
|
|
||
|
|
Integrated Publishing, Inc. - A (SDVOSB) Service Disabled Veteran Owned Small Business
|