|
||
|
|
||
| |||||||||||||||
|
|
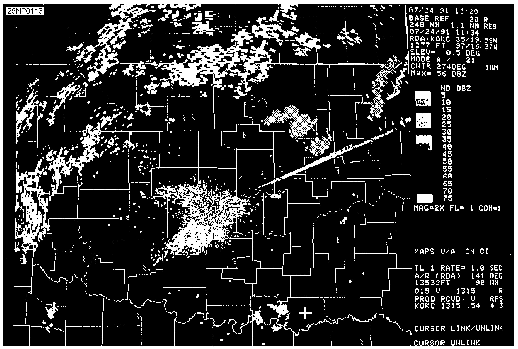
Click here to Order your Radar Equipment Online Sidelobes An occasional source of data contamination is simultaneous reception of signals at comparable power levels through both the main antenna pattern and its sidelobes (part B of the FMH-11). RECOGNITION OF SIDELOBES. Sidelobes are found to the right, left, above, and below high reflectivity areas. Potential interference from sidelobes can be diagnosed by knowing how much difference in power there is between the main beam and the sidelobe. The location of potential sidelobe interference will be specified by a particular number of degrees between the axis of the main beam and the sidelobe. The velocity field of sidelobes will display noisy or erratic values. Spectrum widths will achieve extreme values and are the best indicator of sidelobe interference. ASSESSING IMPACTS OF SIDELOBES. The presence of sidelobes may indicate erroneously high storm tops or new storm growth where there is none. Sidelobes can also impact velocities in a weak echo region, where mesocyclones occur, by providing noisy or erroneous values that mask true velocity patterns. Algorithmic output may be affected. Solar Effects Due to the sensitivity of the WSR-88D, anomalous returns near sunrise or sunset usually appear for several radials. These returns are generated because the sun radiates energy in the same microwave region of the electromagnetic spectrum that is used by the WSR-88D. RECOGNITION OF SOLAR EFFECTS. These echoes may be expected to appear as continuous returns, in a narrow "baseball bat" shape, out one or two radials at the solar attitude. Reflectivity values generally range between 10 and 20 dBZe. See figure 12-5. Solar effects will appear for one or two volume scans at a single elevation of the Reflectivity, Mean Radial Velocity, or Spectrum Width product and up to 30 min on a Composite Reflectivity product. ASSESSING IMPACTS OF SOLAR EFFECTS. In the absence of other echoes, typical reflectivity values from solar effects are from near zero dBZe in close to the radar, to 20 dBZe or higher at 250 nmi. The apparent reduction in the suns signal nearer the radar is due to the range normalization correction applied to reflectivity. The velocity and spectrum width fields indicate range-aliased data out to the maximum range of these products, that is, 124 nmi. Other Reflectivity-derived products that will show this contamination are the Echo Tops, Composite Reflectivity, and Layer Composite Reflectivity. The Storm Series algorithms will generally not be affected since the reflectivity values are below the thresholds used to detect storms. Velocity-derived products that will be contaminated are the Storm Relative Mean Radial Velocity Map, and Region. At longer ranges, the contaminated radial may disrupt pattern vectors used to identify circulations in the mesocyclone algorithm, where the suns signal is stronger than the corresponding storm echo. At close-in ranges, the suns signal is too weak to impact the Tornadic Vortex Signature algorithm. The solar effects can also cause erroneous output and increase edit time of the radar-coded message in these areas. INTERPRETATION OF DOPPLER VELOCITY PATTERNS Although a single doppler radar observes only the component of the wind in a radial direction from the
Figure 12-5.-Streaks of low reflectivity extending outward for two radials to the northeast of the radar caused by solar effects. radar, a wide variety of weather features of great importance can be identified. It is beyond the scope of this manual to describe the interpretation of doppler velocity patterns. For a detailed explanation of the interpretation of doppler velocity patterns refer to the FMH-11 (part B). MESOCYCLONE SIGNATURE DETECTION Mesocyclones have been found to be precursors to many tornadoes. They generally have a core diameter of 1.5 to 5 nmi, maximum tangential velocities of 40 kts or greater, and time and height continuity. Previous doppler experiments have found that weak mesocyclone signatures generally result in severe thunderstorms. Stronger signatures generally produce tornadoes, especially if a tornadic vortex signature is present. If an alert is received that a mesocyclone exists, or if there is no alert, but a mesocyclone is suspected, there are several products that can be used to confirm its presence. These products and how they might be used are discussed in the following paragraphs. This information is now available on CD in Adobe PDF Printable Format |
|
Privacy Statement - Press Release - Copyright Information. - Contact Us - Support Integrated Publishing |
|
|
Integrated Publishing, Inc. - A (SDVOSB) Service Disabled Veteran Owned Small Business
|