|
||
|
|
||
| |||||||||||||||
|
|
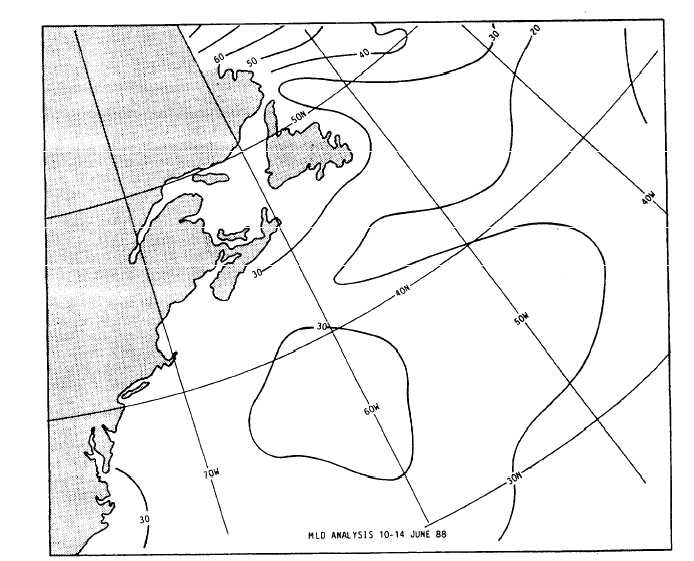
Plotted Data Like SST data, more than 1 days worth of layer-depth data is plotted on the same chart. See figure 1-4-7. Plotted layer depths may or may not have a (+) or a (p) plotted behind the report.
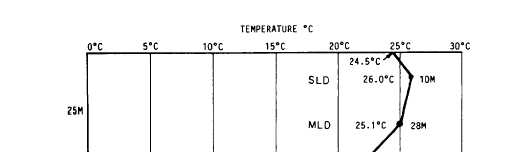
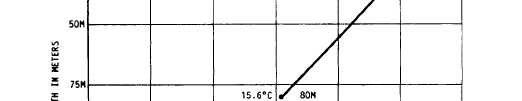
Figure 1-4-6.-Sonic-layer depth (SLD) determined using BT analysis.
Figure 1-4-7.-Example of a MLD chart. A (+) denotes the reported value is or may be greater than that indicated. A (p) is plotted if a positive temperature gradient exists from the surface to the MLD. If both a positive gradient and a possibly deeper layer depth exists, the and (+) are both plotted. Analysis Procedure The mixed layer is analyzed by drawing isopleths of equal layer depth. Like isobars, these lines should be smooth flowing and never cross or touch. Unlike isobars, there will be no sharp turns or kinks. Isopleths are drawn at 60-meter intervals in winter and 15-meter intervals in summer. In winter, the mixed layer extends to much greater depths than in summer; therefore, the 60-foot interval is used. In summer, the mixed layer is much shallower and the 15-meter interval is required. As you might expect, there are even less bathythermograph observations to work with than there are SST observations. Therefore, past history is extremely important. I recommend that you place the last analysis under the current plotted chart and do the current analysis on a light table. If a light table is not available, use a yellow pencil and transpose as many of the historical isopleths as necessary onto the current chart. Another aid in regions with few or no layer-depth observations is the latest SST analysis. The SST analysis is used to determine the SST advection pattern, which in turn is used to evaluate reported layer depths and to justify increasing or decreasing layer depths in a region. factor, the vertical temperature gradients, controls the sound ray paths.
|
|
Privacy Statement - Press Release - Copyright Information. - Contact Us - Support Integrated Publishing |
|
|
Integrated Publishing, Inc. - A (SDVOSB) Service Disabled Veteran Owned Small Business
|