|
||
|
|
||
|
Page Title:
The NGM Prognostic Chart Series |
||
| |||||||||||||||
|
|
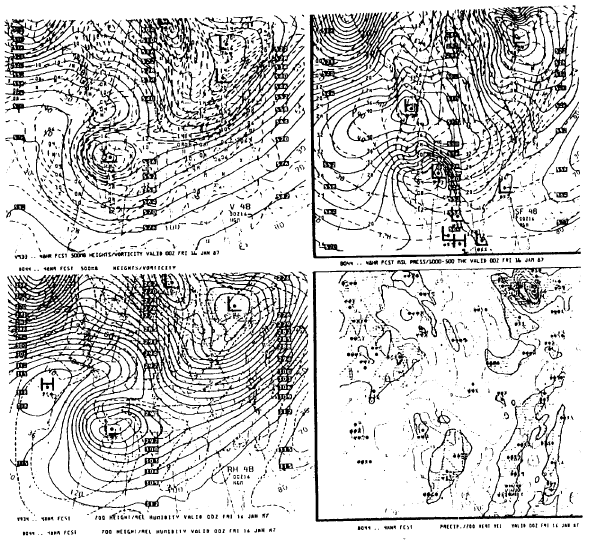
The NGM Prognostic Chart Series The NGM prognostic chart series has effectively replaced the LFM chart series as of this writing. This series consists of a set of four charts, or panels, for each forecast time: 12, 24, 36 and 48 hours. An example of the 48-hour forecast set is shown in figure 4-3-13. The charts or panels consist of (1) the 500-millibar heights and vorticity panel, (2) the mean sea level pressure and 1,000-to-500-millibar thickness forecast, (3) the 700-millibar height and relative humidity forecast, and (4) the precipitation and 700-millibar vertical velocity forecast. These four panels may be sent on one chart, as in the example, or individually. The series is produced twice each day from the 0000Z and 1200Z data collections. 500-MILLIBAR HEIGHTS AND VOR-TICITY. On this panel the 500-millibar isoheights are depicted with solid lines and labeled in decimeters. Absolute vorticity is depicted with dashed lines every 2 X 10⁻⁵ units per second and labeled 2, 4, 6, etc. Areas of relative vorticity maxima are indicated by an X, while areas of relative vorticity minima are indicated by an N. Since vorticity advection is often more important in forecasting than is the vorticity value, you may find it helpful to do your own vorticity advection analysis. You do this by draw-ing in the axes of minimum vorticity values through the Ns (the vorticity troughs) and the axes of maximum vorticity through the Xs (the vorticity ridges). Any area on the downwind side of a vorticity ridge, where the vorticity pattern is not parallel
Figure 4-3-13.-NGM prognosis chart. to the height contours, is an area of positive Typically, these areas are shaded in red pencil. Positive vorticity advection shows a tendency for the air to increase its up-ward velocity. This means that clouds will tend to form or become thicker and that precipitation will tend to begin or become heavier/more wide-spread. Any area on the downwind side of a vorticity trough, where the vorticity pattern is not parallel to the isoheights, is an area of negative vorticity to dissipate cloudiness. Vorticity ridges, sometimes called vorticity maxima lobes, tend to overlie short-wave troughs, These may be more evident on the lower level 700-millibar isoheight forecast as height troughs or on the surface forecast as a pressure trough (frontal or non-frontal). MEAN SEA LEVEL PRESSURE AND 1,000-TO-500-MILLIBAR THICKNESS FORE-CAST. Isobars are drawn with solid lines every 4 millibars and labeled in tens and units of millibars. Surface high-pressure centers are labeled with an H, and low centers with an L. An X within a circle indicates the exact forecast center position. The 1,000-to-500-millibar-layer thickness is indicated with dashed lines every 60 meters and is labeled in decameters. Thickness contours and isobar patterns should greatly assist you in your determination of frontal placement on these forecast charts. Thickness lines are closer together (packed) on the cold-air side of warm and cold fronts, which lie in the troughs of low pressure. Slight bends in the thickness pattern can indicate a pressure trough or a very weak frontal system. A large bulge in the thickness pattern either parallel to the surface isobars or toward lower pressure usually indicates an occlusion. 700-MILLIBAR HEIGHTS AND RELA-TIVE HUMIDITY. On this panel, the 700-millibar isoheights are drawn in solid lines every 30 meters and are labeled in decimeters. High and low height centers are labeled in decimeters as well. The average surface-to-500- millibar relative humidity values are drawn in dashed lines from 10 to 90 percent. Values greater than 70 percent are shaded. Short-wave determination is best done on this chart, using the vorticity forecast as a guide. 700-MILLIBAR VERTICAL VELOCITY AND PRECIPITATION. On this panel, the thin solid lines indicate vertical velocity, or the upward/downward movement within a column of air. Isopleths are drawn every 3 microbars per second, and labeled in microbars. A positive value means the air is rising, while a negative value means the air is sinking. A microbar is a unit of pressure (0.001 millibar). A 3-microbar-per-second vertical velocity equates roughly to air rising at 0.11 feet per second (near 700 millibars). The bold solid lines indicate forecast precipita-tion accumulations for the 12-hour period ending at the forecast time (valid time) of the chart. Although these lines are not labeled, they are drawn at 1/2-inch intervals starting at a trace. The area between alternate contours is shaded so that shading represents accumulated precipitation from a trace to 1/2 inch, 1 inch to 1 1/2 inches, 2 to 2 1/2 inches, etc. Additionally, relative precipitation maximum centers are identified with an X within a circle and are labeled in hundredths of an inch. Precipitation amount is the only time-phased parameter on the NGM chart series. |
|
Privacy Statement - Press Release - Copyright Information. - Contact Us - Support Integrated Publishing |
|
|
Integrated Publishing, Inc. - A (SDVOSB) Service Disabled Veteran Owned Small Business
|