|
||
|
|
||
| |||||||||||||||
|
|
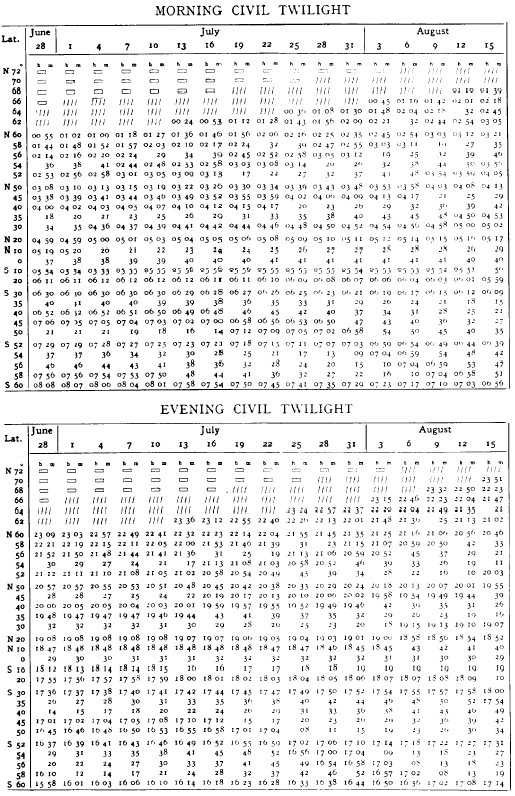
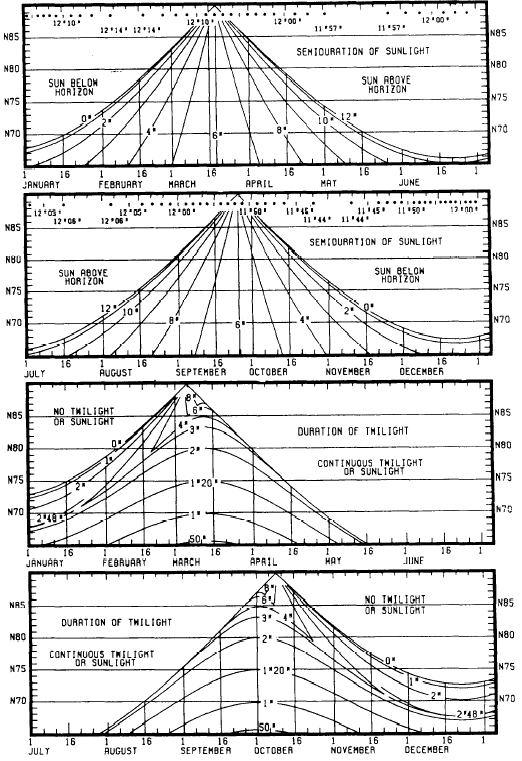
SUNLIGHT AND TWILIGHT GRAPHS The Sunlight and Twilight graphs (table 6-7-4) are used to compute sunrise, sunset, and twilight for latitudes north of 72N. As you can see, the table consists of two sets of graphs; the top two graphs are the Semiduration of Sunlight graphs, and the lower two graphs are the Duration of Twilight graphs.Semiduration of Sunlight Graphs The Semiduration of Sunlight graphs are the top two graphs of table 6-7-4. The upper graph covers the first 6 months of the year, and the lower graph covers the last 6 months. The months are broken down into 5-day increments across the bottom of the graphs. The latitudes 65N to 90N are listed on the sides, and a listing of Local Mean Times lies across the top.The curved or skewed lines in the graphs are the semiduration-of-sunlight lines semiduration meaning one-half of the total daylight period on a particular date. The semiduration line labeled 6, for example, indicates that there are 6 hours of daylight between the time of sunrise and noon LMT (one-half of the total time of daylight) and 6 hours between noon LMT and sunset (the other one-half of the daylight period).Two areas of each graph are without semiduration lines. The area to the left above the 0-hour semiduration line on the upper graph and the area to the right above the 0-hour semidura-tion line on the lower graph are labeled "Sun Below Horizon." If the intersection of a latitude and date falls within these areas, it means the Sun would remain below the horizon throughout the day at that latitude; sunrise would not occur. The area to the right above the 12-hour semiduration line on the upper graph and the area to the left above the 12-hour semiduration line on the lower graph are labeled "Sun Above Horizon." If the intersection of a latitude and date falls within these areas, the Sun would remain above the horizon throughout the day at that latitude; the Sun would not set.Lets try a couple of dates and latitudes and see how to use this graph to determine the times of sunrise and sunset.EXAMPLE 1: Date, July 16; latitude, 70N. Step 1. Locate 16 July along the date scale at the bottom of the lower graph and extend a line vertically to the top of the graph.Step 2. Locate latitude 70N and extend a line horizontally across the graph.Step 3. Where the two lines intersect, read the semiduration period. In example 1, the point of intersection falls within the "Sun Above Horizon" area. On this date at this latitude, the Sun does not set; it stays above the horizon all day.EXAMPLE 2: Date, 21 September; latitude, 75N.Step 1. Locate 21 September along the date scale on the lower graph and extend a line vertically so that it intersects the time scale at the top of the graph.Step 2. Read the time of meridian passage at the point where the date line intersects the time scale. The time is 11:53 LMT.Step 3. Locate 75N and extend a line horizontally across the graph to intersect the date line.Step 4. At the point of intersection, read the semiduration period. Since the point of inter-section falls approximately halfway between theTable 6-7-3.-Sample Page of Civil Twilight Data
Table 6-7-4.-Sunlight and Twilight Graphs
6-hour and 7-hour lines, well call the semidura-tion period 6 1/2 hours.Step 5. Subtract 6 1/2 hours from the time of meridian passage to find the time of sunrise and add 6 1/2 hours to find the time of sunset, as follows: EXAMPLE 3: Date, 1 November; latituide, 79N. Step 1. Locate 1 November along the date scale at the bottom of the lower graph and extend a line vertically to the top of the graph. Step 2. Locate 79N and extend a line horizon-tally to intersect the date line. Step 3. At the point of intersection read the semiduration period of sunlight. Since the inter-section point in this example falls in the area of Sun Below Horizon, the Sun will not rise above the horizon at this latitude. There will be no sunrise or sunset on this date at this particular latitude. |
|
Privacy Statement - Press Release - Copyright Information. - Contact Us - Support Integrated Publishing |