| Tweet |

Custom Search
|
|
 
|
||
|
CALCULATING PERCENTAGES AND DETERMINING RATES A statistical aid to the MA in analyzing statistical data is the calculation of percentages and rate determination. With your information, using either the percentage or rate form (whichever is appropriate), you can see where your problem areas lie. Calculating Percentages Percentages are helpful in the presentation of statistical data in briefings or reports. A percentage is that part that is considered in relation to the whole and calculated on the basis of 100. The following is an example of the calculation of percentage: Example: If 800 offenses occurred during a certain month, 40 thefts would constitute 5 percent of the total number of offenses. To arrive at this result, the following computations are made.
Divide the base figure into the figure being compared to the base and multiply the result by 100 for percentage.
This method may also be used to determine percentage of increase or decrease of military personnel within your area of jurisdiction. The only difference is that an additional computation must be made to determine the actual increase or decrease involved. Example: Military personnel increased in strength from 4,852 in July to 5,294 in August. The percentage of increase is 9.1 percent.
The base figure is 4,852. The figure being compared to the base is 442. The formula for this example is
Percentage of decrease is calculated in the same manner. Determining Rates A rate is generally expressed in terms of frequency per some standard unit, as 100; 1,000; 10,000; 100,000. These figures (100, 1,000, and so on) are arbitrary figures and act as a common denominator to facilitate evaluation and comparison. An example of rate determination is the following: Example: If 600 offenses occurred during a certain period and 30,000 military were stationed there during this period, the offense rate per 1,000 personnel is 20 (offenses per 1,000). The formula used to arrive at this result is
equals rate per standard unit. In applying this formula to our example, it would appear like this:
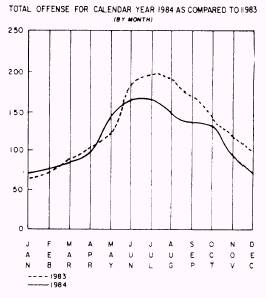
COMPILATION, COLLECTION, AND PRESENTATION OF STATISTICAL DATA The statistical facts required are, for the most part, to be found in the records and reports. These reports are submitted by personnel who are engaged in the various activities under your control or technical supervision. You should make a continuing study of these records and reports. Ensure that required statistical data is being reported or recorded and that it is current and accurate. The methods used in securing the data and maintaining the records and reports must be simple, flexible, and commensurate with the personnel available for their preparation. Essential facts to a problem or situation are extracted from records and reports. These facts are then converted into accurate and understandable measurements of the problem or situation. Uniform records and reports, together with other locally required records and reports, will contain several facts. Some of these facts will be of assistance in analyzing the character, the extent, the location, and the time of occurrence of incidents that require action. Essential facts required for statistical analysis are not always available in required records and reports. In this case, you must learn whether the data is available in other staff activities of a higher or lower command. If it is necessary to make original collection of the required facts, the arrangements are made through authorized charnels for such collections. When a special report on essential facts is received, it may either cover an entire subject or be limited to a sampling of the subject matter. Sampling is a statistical technique. In sampling a representative part of a population or group, carefully chosen samples are usually sufficiently accurate for statistical study. Allowance is made for any margin of error that is considered to be the normal error for that particular method used. Standard sampling principles must be observed if valid results are to be obtained An aggressive and imaginative MA will use many different techniques in presenting statistical data. Each presentation should be accurately and carefully tailored to fit the situation and the facts being presented. Methods such as the following maybe used. l Written analytical report. This type of report may be required at regular intervals and may, for purposes of clarity, be augmented by appropriate charts or graphs. It provides the commanding officer with a permanent record. l Graphic presentation. A graph or a chart provides you with a medium for presenting, in a clear, understandable, logical, and interesting manner, a collection of facts. The meaning of these facts presented in another medium might not be clear. A graph or a chart assists the commanding officer to analyze and compare data quickly, permits the condensation of facts and figures, and demonstrates deficiencies and trends. A graph provides the same information as a table but usually has the advantage of greater simplicity and clarity. The following features are found in most graphs: a. A distribution of a group of values or of a trait or characteristic b. A brief, simple, and direct title describing what the graph represents c. The unit or units of measure used Take care in preparing graphs in order to avoid faulty presentation and interpretation. Data are usually obtained from various reports, records, or surveys. They appear as unorganized groupings or statements of numbers or facts. By systematic rearrangement of classification, you may give meaning and significance to data. This will facilitate comparisons with other groups of similar data, as well as further analysis of the rearranged facts. The basic data may be rearranged as follows: l The largest and smallest numerical values are located. l The difference between these two values-that is, the range-is determined. . The values are grouped in the order of their magnitude, in groups of twos, threes, fours, fives, or tens. The size of this grouping factor, called the class interval, normally is such that no fewer than 10 or more than 20 of such groupings result. Consideration is given, however, to the total number of numerical values with which it is necessary to deal. Fundamentals of Graphic and Tabular Charts Let's discuss the different types of table charts that are used in the security department to help display information. CURVE CHART.- The curve or line chart (graph) (fig. 18-4) is probably the most widely used form of graphic presentation. It is very simple to construct and is most effective when the emphasis is on movement rather than an actual amount. The curve chart is normally used when data covers a long period of time. It is also possible to compare two or more series on the same chart. The curve or line chart maybe used to show trends in various enforcement activities, such as total AWOLs, vehicle registrations, offenses, apprehensions.
Figure 18-4.-Curve chart. |
 
|
|
|
||