Custom Search
|
|
 
|
||
|
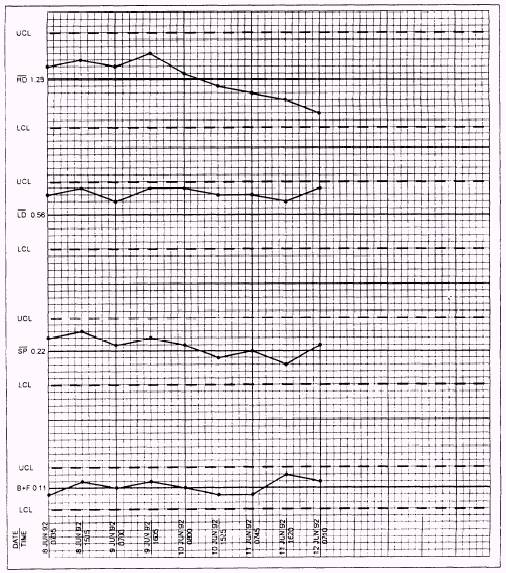
A process control chart provides a visual representation of a process. Control strips that are processed and read on a densitometer are then plotted on a control chart. The points plotted on the graph indicate what has occurred in the process at the time the control strip was processed. Through the use of control charts, a determination can be make whether the process is operating normally. As stated before, only selected steps of a control strip are monitored. For black-and-white film, the minimum steps monitored are as follows: base plus fog (B + F) or gross fog, high density, low density, speed point, and contrast. For each step monitored on a control chart, there are three lines. The center line represents the mean (X) (pronounced bar X ), or average, a top line that represents the upper control limit (UCL), and a bottom line that represents the lower control limit (LCL).
Figure 10-28. Process control chart. Refer to figure 10-28. For example purposes only, the following steps are monitored and plotted on a control chart below. The steps being monitored are as follows: High density (HD) is step 17 and reads 1.20. Low density (LD) is step 6 and reads 0.60. Speed point (SP) is step 4 and reads 0.23. B+F is 0.12. When plotting a control strip, you should always annotate the date and the time the control strip was processed. When all points plot within the upper and lower control limits, the film can be processed. When any point plots outside the upper control limit (UCL) or lower control limit (LCL), the process is out of control. You should notify your supervisor before processing any material through that particular process. |
 
|
|
|
||