|
||
|
|
||
|
Page Title:
Thermocline and Mixed Layer Relationships |
||
| |||||||||||||||
|
|
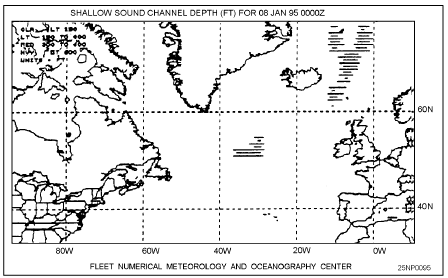
Click here to Order your Radar Equipment Online Thermocline and Mixed Layer RelationshipsShallow subsurface sound channels occur in the upper levels of the water column in the thermocline. The thermocline is the layer of sea water where the temperature decreases continuously with depth between the isothermal mixed layer and the deep sound channel axis. The relative strength of a sound channel depends upon the thickness of the channel and the maximum angle of the trapped rays.Geographic Locations Studies indicate that shallow sound channels beneath the mixed layer depth occur most often north of 40N in the area between Hawaii and the continental United States. They are also frequently observed in the vicinity of the Gulf Stream. The prevalent depth of these shallow channels ranges from 90 to 150 meters.During the summer a shallow channel exists in the Mediterranean Sea. In this region, the heating by the sun of the upper layers of the water, together with an absence of mixing by the wind, causes a strong near-surface negative gradient to develop during the spring and summer months. This thermocline overlies isothermal water at greater depths. The result is a strong sound channel with its axial depth near 100 meters. Although shallow sound channels are more local and transitory in nature, they often have a strong effect on sonar operations.There are three graphic outputs available with the SSX product:1. A shaded shallow sound channel axis depth display. The amount of shading indicates the range of depth in feet. See figure 9-10.Clear None (or depth <150 ft or >1000 ft) Light axis depth 150-300 feet Medium axis depth 300-600 feet Heavy axis depth 600 1,000 feet 2. A shaded shallow sound channel magnitude (strength) display. The amount of shading indicates the
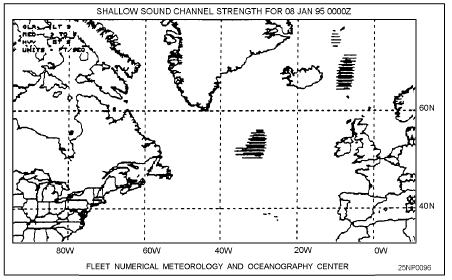
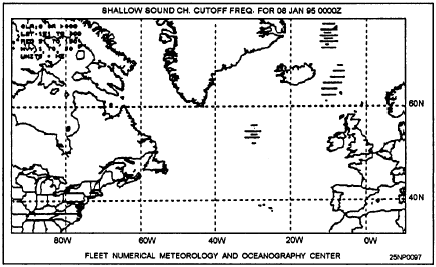
Figure 9-10.-A shaded shallow sound channel axis depth display. strength of the shallow sound channel (SSC) at those grid points where these channels exist and meet minimal descriptive criteria. See figure 9-11.Clear No shallow sound channels or strength <3 ft/secLight Strength 3 5 ft/sec Heavy Strength >-5 ft/sec 3. A shaded shallow sound channel cutoff frequency display. The amount of shading indicates the limiting frequency of the shallow sound channel. See figure 9-12.Clear No shallow channels or frequency> 300 HertzLight Frequency 151 300 Hertz Medium Frequency 51-150 Hertz Heavy Frequency 1- 50 Hertz
Figure 9-11.-A shaded shallow sound channel strength display.
Figure 9-12.-A shaded shallow sound channel cutoff frequency display. The first portion of this chapter was devoted to those oceanographic products that were accessed using the NODDS.We will now discuss phenomena and principles covered in the Fleet Oceanographic and Acoustic Reference Manual, RP33. A brief overview will be presented for each area discussed. For more information, see RP33.FORECASTING EFFECTS OF AMBIENT NOISELEARNING OBJECTIVES Distinguish ambient noise from self-noise. Identify characteristics of surface ship traffic and sea-state noises.The problem of listening for recognizable sounds in the ocean is to distinguish them from the total noise background. Ambient noise is that part of the total noise background not due to some identifiable localized source. It exists in the medium independent of the observers activity. Interfering noise sources that are located on, or are a part of, the platform on which a sensor is installed are sources of self-noise.This information is now available on CD in Adobe PDF Printable Format |
|
Privacy Statement - Press Release - Copyright Information. - Contact Us - Support Integrated Publishing |