|
||
|
|
||
| |||||||||||||||
|
|
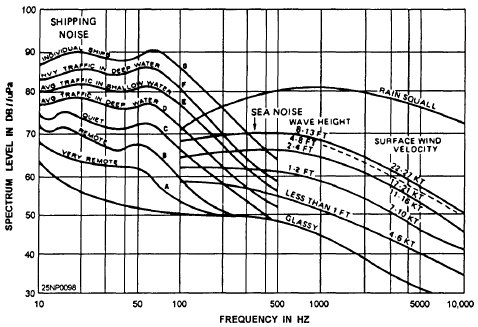
Click here to Order your Radar Equipment Online AMBIENT NOISE Deep-sea ambient noise measurements have been made over a frequency range from 1 Hz to 100 kHz. Over this range the noise is due to a variety of sources, each of which may be dominant in one region of the spectrum. Principal sources of ambient noise in the frequency range of about 30 Hz to 10 kHz are distant shipping and wind-generated surface agitation. Other important contributors are rain, ice, and biological activity. Under certain conditions, these latter sources of background noise can seriously interfere with detection systems; however, not enough is known about their occurrence to permit meaningful predictions. Figure 9-13 indicates ambient levels of shipping and sea noise. Figure 9-13 may be analyzed as follows: Along the Gulf Stream and major trans-Atlantic shipping lanes, the heavy traffic predictor (curve F) forecasts average noise within 2 dB at 100 and 200 Hz. Maximum values usually occur with ships closer than 10 nmi and the values follow the individual ships curve (curve G), Minimum values vary radically but appear to group around the average traffic curve (curves D and E). For 440 Hz, the predictor curves appear to be 2 or 3 dB too low.
Figure 9-13.-Ambient noise levels. Four or more ships closer than 30 nmi constitute heavy noise, with ships closer than 10 nmi driving the noise level up to the individual ships target curve (curve G). Where the bulk of the traffic is farther than 40 nmi, the average traffic curves (curves D and E) apply. This does not apply to a carrier task group. Correlations of noise intensity with distance to nearest ship, with all ships present in the shipping lanes, were negative. For areas not immediately in a heavy traffic area, ship concentration and distance became critical. This information is now available on CD in Adobe PDF Printable Format |
|
Privacy Statement - Press Release - Copyright Information. - Contact Us - Support Integrated Publishing |
|
|
Integrated Publishing, Inc. - A (SDVOSB) Service Disabled Veteran Owned Small Business
|