|
||
|
|
||
|
Page Title:
Mid-range Temperature Anomaly Forecast |
||
| |||||||||||||||
|
|
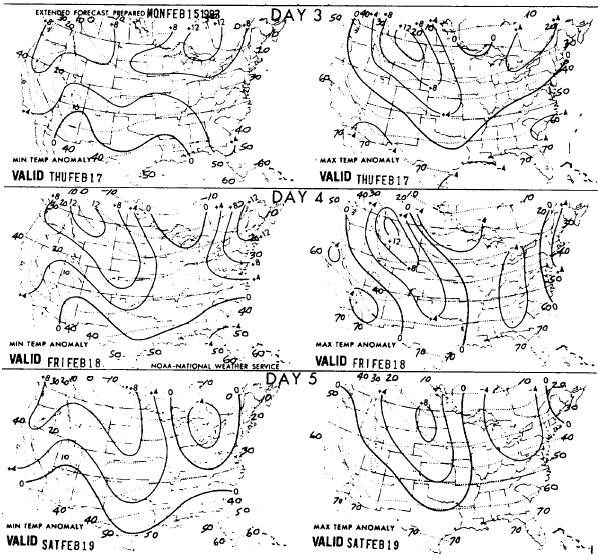
Mid-range Temperature Anomaly Forecast Figure 4-3-18 shows an example of a tempera-ture anomaly forecast. This product is received at most stateside NOCDs and Marine Corps Weather Detachments. Too often it is not understood and is discarded or ignored. It has three panels, for day 3, day 4, and day 5. Each panel has a diagram for the minimum temperature anomaly (MnTA), or difference from normal, and a second for the maximum temperature anomaly (MxTA). The MnTA usually is representative of the early-morning temperature, while the MxTA is representative of the afternoon temperature of the same day. Solid lines represent the anomaly or difference from the climatological mean maximum and mean minimum temperatures. These anomaly lines are drawn every 4 degrees Fahrenheit. The dotted lines represent 10F isotherms of the climatological temperatures. The MnTA diagram shows climatological minimum temperatures, while the MxTA diagram shows climatological maximum temperatures. These climatological backgrounds usually change every 2 weeks. Climatological background temperature periods used are valid from the 7th to the 21st of the month, and from the 22d of the month to the 6th of the next month. To use this chart to obtain a temperature forecast for days 3 through 5, add the anomaly to the charted climatological temperature. You may also use your stations climatological temperature for greater accuracy. Use the monthly average maximum and minimum temperatures for forecasts valid for the middle-of-the-month period. Average the adjoining months monthly maximum and minimum temperatures to get a set of maximum and minimum temperatures to use for the monthly transition periods. For example, lets say that it is Monday after-noon, February 14, 1983. To find the forecast temperatures for Friday, February 18, 1983 (day 4, or the middle panel of figure 4-3-18) for Norfolk, Virginia, you would read the climatological base temperatures on the chart. You should read the temperature as 33F on the MnTA chart and 51F on the MxTA chart. Next, find the forecast anomalies. You should read +4 for the MnTA and +1 for the MxTA. These values indicate that the minimum temperature Tmix will be 4F above normal and the maximum temperature Tmax will be 1F above normal. Now add the anomalies to your climatological base temperatures. You will find a forecast Tmin for Friday morning of 37F (33 + 4 = 37F). The forecast Tmax for Friday afternoon would be 52F (51 + 1 = 52F). You could use your stations climatological mean minimum and maximum temperatures instead of the charted temperatures. NAS Norfolks mean maximum temperature is 51F, and the mean minimum is 32F. Adding the anomaly values to these temperatures would yield a more specific temperature forecast for Chambers Field. If we were forecasting temperatures for the end-of-the-month period (22 February to 6 March) we would have to average the mean maximum and mean minimum temperatures for the two months to obtain a set of base temperatures. The mean temperatures for March are 41F and 57F. We would find 37F [(41 + 32)/2 = 37F] for a mean minimum temperature and 54F [(51 + 57)/2 = 54F] for a mean maximum temperature. Check the charted climatological base temperatures and determine if the end-of-the-month background change is actually done as anticipated. The anomalies are calculated using the background temperatures that appear on the chart, even though the change in the background temperatures may be done a few days early or late. So far we have covered the most commonly used charts produced by the NWSs NMC. Several bulletins are routinely used that are in a more coded format for brevity of transmission. All bulletins are identified by a bulletin heading called a MANOP header. These were discussed in AG3, Appendix XI. Lets look at a few of the more frequently used coded bulletins to determine what information they contain.
Figure 4-3-18.-Days 3, 4 and 5 Mid-range Temperature Anomaly Prognosis chart. Learning Objective: Interpret commonly used National Weather Service bulletins. FREQUENTLY USED NWS BULLETINS Of the literally thousands of bulletins issued by the NWS, many are self explanatoryan information line adequately describes what information is presented. Many are observation reports, which are simply groups of coded observations. You have learned many of these observation reporting codes already. Others are forecasts or warnings in plain language. Many bulletins are so specialized that most Aerographers will have little need to know how to decipher them. Several frequently used bulletins, however, are coded and require a specific knowledge to use the data. Those are the bulletins we will cover in this section. They are the LFMII forecast output, the NGM forecast output, the MOS forecasts, and the trajectory forecasts. |
|
Privacy Statement - Press Release - Copyright Information. - Contact Us - Support Integrated Publishing |
|
|
Integrated Publishing, Inc. - A (SDVOSB) Service Disabled Veteran Owned Small Business
|