Custom Search
|
|
  |
|
|
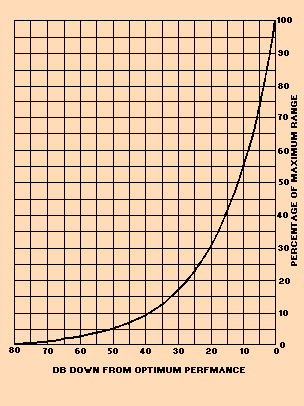
The performance of a radar receiver is determined by several factors, most of which are established in the design engineering of the equipment. In the paragraphs that follow, factors concerned with maintenance are considered. Important factors are (1) receiver sensitivity, which includes noise figure determination and minimum discernible signal (mds) measurement; (2) tr recovery time; and (3) receiver bandwidth. Many radar systems contain circuits that serve special functions. Three of these special circuits are instantaneous automatic gain control (iagc), sensitivity time control (stc), and fast time constant (ftc). These circuits may be found in combination or alone, depending on the purpose of the radar. When the test methods and procedures about to be described are used, these special functions should not be used. If an automatic frequency control (afc) circuit is included in the radar, it may be permitted to operate during receiver tests. A good way you can check afc circuit operation is to complete the tests specified for manual tuning and then switch to afc. If the afc circuit operation is normal, test indications should not differ. RECEIVER SENSITIVITY Insufficient detection range in a radar system can be caused by decreased sensitivity in the radar receiver. This condition results mainly from the great number of adjustments and components associated with the receiver. A decrease of receiver sensitivity has the same effect on range performance as does a decrease of transmitter power. For example, a 6 dB loss of receiver sensitivity shortens the effective range of a radar just as much as a 6 dB loss in transmitter power. Such a drop in transmitter power is evident and is easy to detect. On the other hand, a 6 dB loss in receiver sensitivity, which can easily result from a slight misadjustment in the receiver, is difficult to detect unless accurate measurements are made. Figure 4-8 shows a comparison of radar system performance versus maximum range. The system performance loss in dB includes both transmitter and receiver losses. You should note that with a loss of 5 dB in both receiver and transmitter (a total of 10 dB), only 55 percent of the maximum range of the system is realized. Figure 4-8. - System performance versus maximum range.
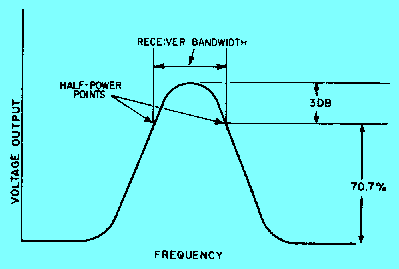
The sensitivity of the radar receiver is a measure of its ability to pick up weak signals. The greater the sensitivity of the receiver, the better the receiver picks up weak signals. You can determine receiver sensitivity by measuring the power level of the MINIMUM DISCERNIBLE SIGNAL (mds). Mds is defined as the weakest signal that produces a visible receiver output (on a scope). Its value is determined by the receiver output noise level (noise tends to obscure weak signals). Because mds measurement depends on the receiver noise level, measuring either mds or noise level (called NOISE FIGURE) will indicate receiver sensitivity. Many radar systems have built-in receiver sensitivity test circuits. These test circuits indicate the sensitivity of the receiver to the technician or operator. To measure the mds, you must measure the power of a test pulse in which the level is just sufficient to produce a visible receiver output. If a radar receiver has the mds level specified in the maintenance manual, then the noise figure should also be correct. Therefore, measurement of the mds is a satisfactory substitute for a noise-figure determination and is less complicated. Because receiver sensitivity readings are taken periodically for comparison purposes, the identical pulse length must be used for each measurement. Maintenance instructions for the radar set usually specify the correct pulse length to be used in receiver sensitivity tests. In most cases, it is the same as the transmitter pulse length. Before any measurements of receiver sensitivity can be made, the receiver must be accurately tuned to the transmitter frequency. If the receiver frequency differs from the transmitter frequency, the most likely cause is an improperly adjusted or malfunctioning local oscillator or transmitter frequency drift. Such problems can be caused by heat or aging components. Local oscillator tuning procedures differ widely according to the type of radar system; therefore, you should follow the tuning procedures in the system maintenance manuals. Two basic methods are used to measure radar receiver sensitivity. One is the PULSE METHOD, in which a pulse of measured amplitude and width is coupled to the receiver. In the second method, you use an fm generator to vary the signal generator output frequency across the receiver bandwidth. This latter method ensures the test signal is within the bandpass of the receiver. The sensitivity of the receiver is equal to the sum of the reading on the signal generator and the attenuations of the connecting cable and directional coupler. Receiver sensitivity is expressed as a negative dBm; for example, -90 dBm expresses the sensitivity of a receiver that can detect a signal 90 dB less than the 1-milliwatt reference level. A typical receiver sensitivity reading on a modern radar should be in the vicinity of -105 dBm. RECEIVER BANDWIDTH TEST Receiver bandwidth is defined as the frequency spread between the half-power points on the receiver response curve. Receiver bandwidth is specified for each radar, but wide variations are often tolerated. If either the bandwidth or the shape of the receiver response curve is not within tolerances, a detailed check of circuit components may be necessary. A considerable change in the value of circuit components is required to alter the response. You should check receiver response after any extensive repair to an IF amplifier. Figure 4-9 shows a typical response curve of a radar receiver. The half-power points are shown as 3 dB below maximum response. Since the curve is plotted in terms of voltage, these points are also represented by the 70.7 percent voltage points as shown in the figure. Figure 4-9. - Typical receiver response curve.
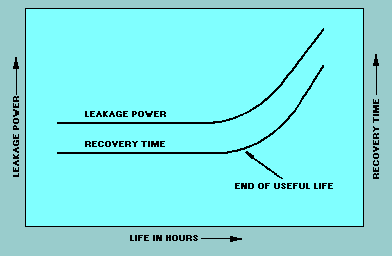
TR RECOVERY TIME The time required for tr recovery is determined by the time taken by the tr switch (tube) to deionize after each transmitter pulse. It is usually defined as the time required for the receiver to return to within 6 dB of normal sensitivity after the end of the transmitter pulse. However, some manufacturers use the time required for the sensitivity to return to within 3 dB of normal sensitivity. Tr recovery time is a factor that limits the minimum range of a radar because the radar receiver is unable to receive until the tr switch is deionized. In various radars, the recovery time may differ from less than 1 microsecond to about 20 microseconds. The primary function of the tr switch is to protect the sensitive crystal detectors from the powerful transmitter pulse. Even the best tr switches allow some power to leak through; but when the switch is functioning properly, leakage power is so small that it does not damage the crystal. However, the useful life of a tr tube is limited because the amount of leakage to the receiver increases with use. To ensure efficient performance, some technicians make a policy of replacing the tr tube after a certain number of hours of use. A better practice is to measure the tr recovery time at frequent intervals and make a graph or chart. A graph or chart will immediately disclose any change in performance. Figure 4-10 shows how the recovery time is correlated with leakage power. Note that the end of the useful life of the tr tube is indicated by an increase in recovery time. Figure 4-10. - Tr recovery time versus leakage power.
This method of checking the condition of a tr tube is reliable because recovery time increases before leakage power becomes excessive. In practice, a tr tube is replaced when any sharp increase in recovery time becomes apparent. Ambient temperature also has an effect on recovery time. The colder a tr tube, the greater its recovery time. When tests are conducted under widely varying temperature conditions, this effect must be considered. One method you can use in testing a tr tube is to measure the KEEP-ALIVE current. This current keeps the tr tube partially ionized, which makes the firing more instantaneous and thus helps protect the receiver crystals. The keep-alive current is normally about 100 microamperes but falls off as the end of the tr tube life approaches. You can also measure the keep-alive voltage between the plate of the tr tube and ground when the voltage source is known to have the correct output. You then record this voltage for use as a reference for future checks. However, these checks are not as reliable as recovery time testing. Specific procedures for measuring tr leakage and recovery time can be found in the equipment technical manuals. Q.7 A loss of receiver sensitivity has the same effect on range performance as what
other loss? |
|